This website uses Cookies. Click Accept to agree to our website's cookie use as described in our Privacy Policy. Click Preferences to customize your cookie settings.

- The Google for Education Community Platform
- Primary and Secondary Education Communities
- Global Google Educator Group
- Gemini Space
- Re: Create a Real-Time Interactive Dashboard Conne...
Options
- Subscribe to RSS Feed
- Mark Topic as New
- Mark Topic as Read
- Float this Topic for Current User
- Bookmark
- Subscribe
- Mute
- Printer Friendly Page
Create a Real-Time Interactive Dashboard Connecting to Google Sheets with Gemini in 4 Easy Steps! By

Options
- Mark as New
- Bookmark
- Subscribe
- Mute
- Subscribe to RSS Feed
- Permalink
- Report Inappropriate Content
Wednesday

The era of spending days coding executive dashboards or relying on complex, expensive software is over. Today, we can use a smart assistant like Gemini to design and write HTML code for an interactive dashboard that fetches data from Google Sheets in real-time, complete with a data update button. Plus, it can be shared as a link for immediate team use.
Let's look at how to magically create an executive dashboard in just 4 simple steps:
1. Access the Gemini App Getting started is easy. Simply open your browser and go to gemini.google.com (make sure you are logged in with your Google account). Have your ideas or the analytical goals of your desired dashboard ready in your mind.

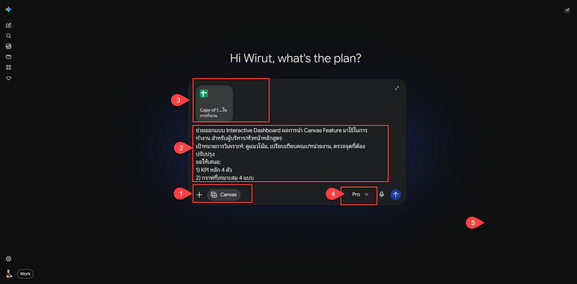
2. Enter a Masterful Prompt The key is to write a prompt that covers both the "requirement context" and the "technical outcome." You can copy and adapt the prompt below:
Prompt Example: "Please design an Interactive Dashboard showing the results of implementing the Canvas Feature in our workflow, aimed at executives/program heads. Analytical goals: track trends, compare faculties/departments, and identify areas for improvement. Please propose:
4 key KPIs
4 suitable types of charts
3 filters
Expected insights
What I need: HTML code along with CSS/JS that can connect data between Google Sheets and the dashboard in real-time (fetching data via a Published CSV). Also, please include an 'Update Data' button on the dashboard interface."
Once you submit the prompt, Gemini will analyze your needs and immediately draft a structure for you. It will provide the complete HTML code, embedding charting libraries and scripts to fetch data from Google Sheets perfectly. Sample Data: https://docs.google.com/spreadsheets/d/1-xxhMU2eX9ioQBst6nhZobttoeae6Lx4j5RAZ1XbjnM/copy
3. Review and Refine with Follow-up Prompts The first version of the code might not be 100% perfect, or you might want to tweak the design further. This is the main advantage of using AI; you can ask for revisions just like talking to your own personal programmer. For example:
"Please change the color of the faculty comparison bar chart to a light-blue and dark-blue tone."
"I want the 'Update Data' button to have a refresh icon and be moved to the top right corner."
"The provided code doesn't load the Google Sheets data. Please check the data fetching section (Fetch API) for me."
Gemini will modify and update the code for you until you are satisfied with the interface and functionality.
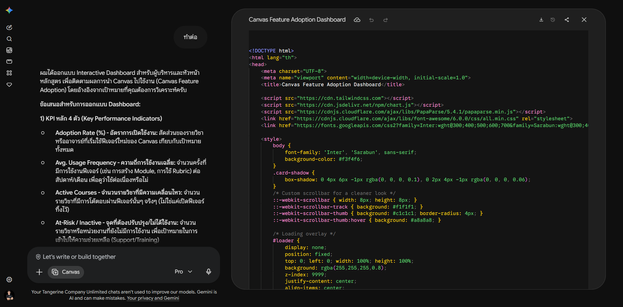
4. Test and Share as a Link for Others to Use Once you have refined it to a satisfactory result, there's no need to go through the hassle of hosting the code on a web server because you can share it directly from the Gemini window.
Set up Google Sheets: Put your data into Google Sheets, then go to File > Share > Publish to web. Choose CSV and give the resulting link to Gemini to update the HTML code.
Create a share link from Gemini: On the Gemini chat screen, click the "Share & export" button below the response and select "Share" (to create a public link).
Send to executives: Copy the generated URL and send it to your executives or team members. They can click it to view the dashboard in action and see the code running directly on the web page.

Using Gemini not only cuts down the working time from days to just a few minutes, but it also professionally guides your ideas in selecting the right KPIs and charts suited for an executive's perspective. Give this method a try and apply it to your data tasks!
wirut khajonchai
Topics:
- Topics:
-
Gemini
3 REPLIES 3


Options
- Mark as New
- Bookmark
- Subscribe
- Mute
- Subscribe to RSS Feed
- Permalink
- Report Inappropriate Content
Wednesday
What an amazing and practical walkthrough @wirut!
Thank you for sharing such a clear, step-by-step method for turning raw spreadsheet data into a polished executive dashboard using Gemini.
Best,
Sabina

Options
- Mark as New
- Bookmark
- Subscribe
- Mute
- Subscribe to RSS Feed
- Permalink
- Report Inappropriate Content
Wednesday - last edited Wednesday
Hey heres a slick update on your workflow.
Change the steps:
- Setup your Google Sheets data and information the way you want it (sheet 1, 2 etc)
- Call Gemini in Sheets (upper right hand corner)
- Adjust your prompt:
I need a dashboard app that can show my data in real time. I want to track student growth and participation metrics and other KPIs. Sheet 1 is "[insert description], Sheet2 is [insert description] (change this to match your data and needs) Include an "Add New X" and an Update "X" (change these to match your needs and methodologies). [insert color scheme if that's important) - Wait in wonderment - a Canvas app will render directly in a new sheet compiling your data to your specifications.
- Adjust your prompt:
Notes: Depending on the .json file you may need to modify it (or have Gemini do it) before hand. This may require massaging it a bit depending on the structure.
Note 2: This feature rolled out in August, you may not have access to it yet if your Administrator team is in testing.
I built a CRM last week and am using it to track our events for one of my cohorts.
Hope this helps to streamline it.
NiKole Technikole Maxwell
Certified Educator: L1, L2, Gemini
Google Cloud Certified Generative AI Leader
NiKole Technikole Maxwell
Certified Educator: L1, L2, Gemini
Google Cloud Certified Generative AI Leader
Certified Educator: L1, L2, Gemini
Google Cloud Certified Generative AI Leader

Options
- Mark as New
- Bookmark
- Subscribe
- Mute
- Subscribe to RSS Feed
- Permalink
- Report Inappropriate Content
Wednesday
Que legal @wirut! Eu mesmo gosto de optar por fazer isso através mesmo do Próprio AppScript por conta da extensão direta, mas achei sensacional seu tutorial aqui!! Parabéns 😊👏
Savio Ferraz

Subscribe
Related Content
